Blitz For Sales Follow-Up is excited to announce an addition to the new user interface. If you missed the prior release notes about Blitz’s new look, Click Here. If you would like to watch a full walk through of the new user interface, Click Here. We would also like to announce a new release to our opportunities feature in Blitz.
Opportunities:
Opportunities are used to track quotes and proposals by dollar value, in order to track ROI, projections, company sales goals, and more. Click Here to learn more about how to use Opportunities in Blitz.
In the new Opportunities menu, you’ll find:
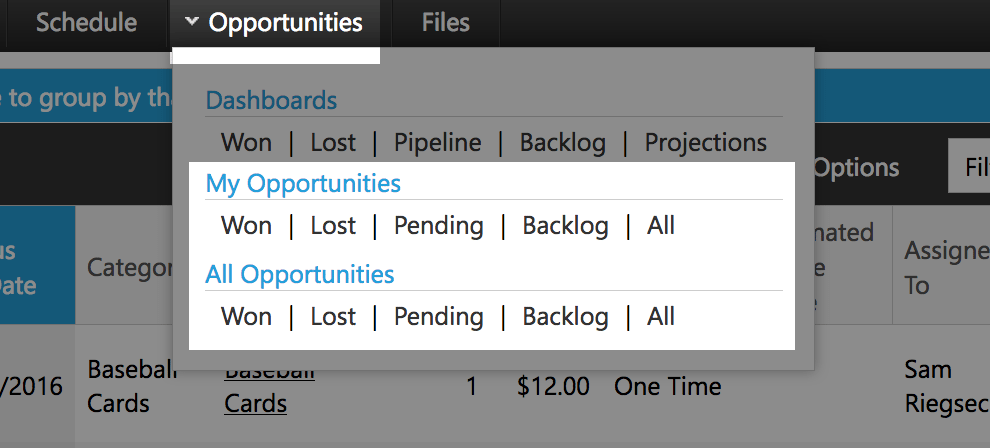
- Dashboards: The Opportunities Dashboard is a new feature that provides a visual breakdown of opportunities based on a date range, and where the lead is in the sales process. Each dashboard displays the same information that was available on the “My Blitz” page in the old user interface, but shown in a more visual and interactive way to view your quote and sales data.
- Opportunities Lists: The list of all Opportunities is now broken down by the Opportunity Status (Won, Lost, Pending) to find and view Opportunities easier.

Opportunities Dashboards:
There are 5 dashboards available:
- Won: Opportunities marked Won
- Lost: Opportunities marked Lost
- Pipeline: Opportunities currently in the pending status
- Backlog: Opportunities that were estimated to close in the past or are missing an Estimated Close Date.
- Projections: Opportunities that are estimated to close between 2 certain dates
Accessing the dashboard from the Admin menu will show an overview of all opportunities in your account. This allows you to watch your company sales pipeline, projections, and the deals you won and lost. Accessing the dashboard from the User menu displays your assigned opportunities, so you can better track your progress with quotes and sales.
You also have the ability to search by status using the drop down option once in the Opportunity Dashboard:
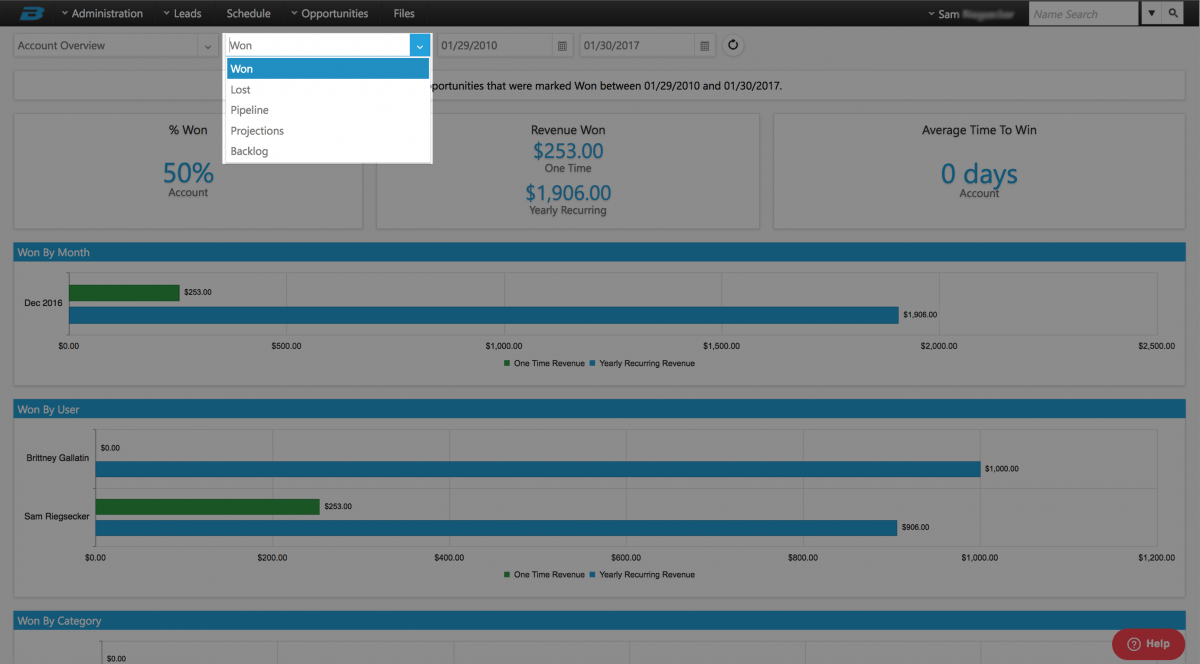
Each dashboard provides bar graphs broken down by the following:
- Opportunities by Month
- Opportunities by User
- Opportunities by Category
- Opportunities by Lead Source
Each section is further broken down by billing cycle (one time, annual etc.). There will be a different colored bar on the graph for each billing type.
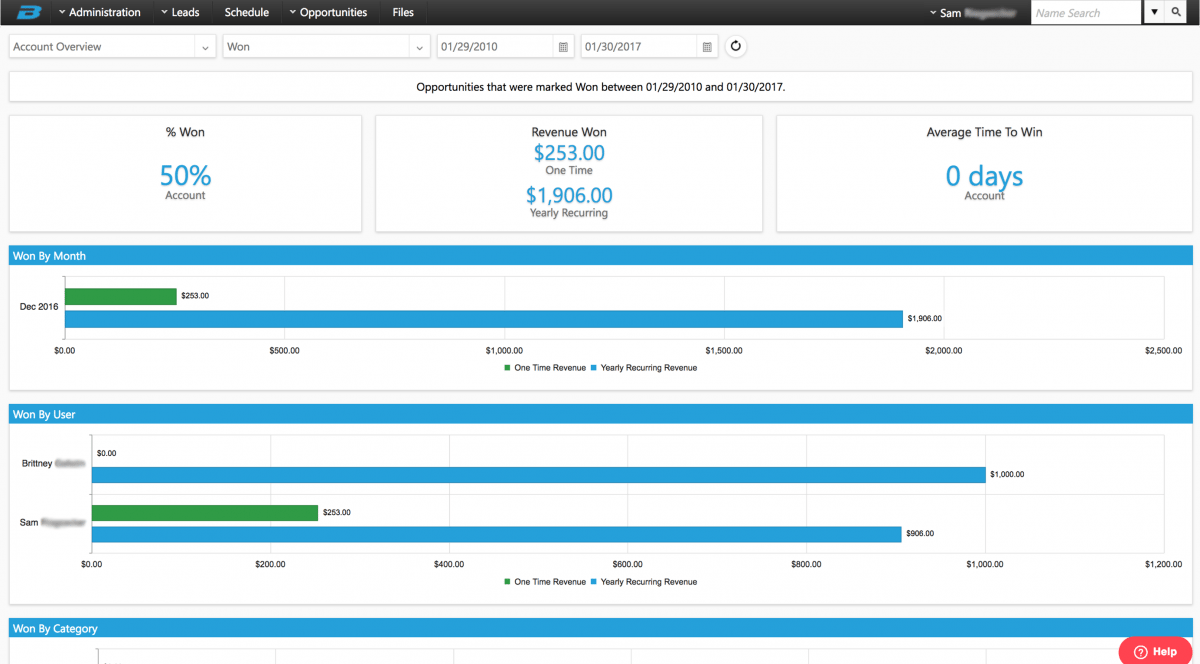
In the image above, showing Won Opportunities for the account, you can see up to date reporting of where your business stands in terms of revenue. The new opportunities menu not only gives you the ability to see your totals in real time but it also allows you to run simple reports monthly, or in the past.
By Clicking on a bar within a graph, the list of opportunities associated with that data will open to show the details and leads they are associated with:
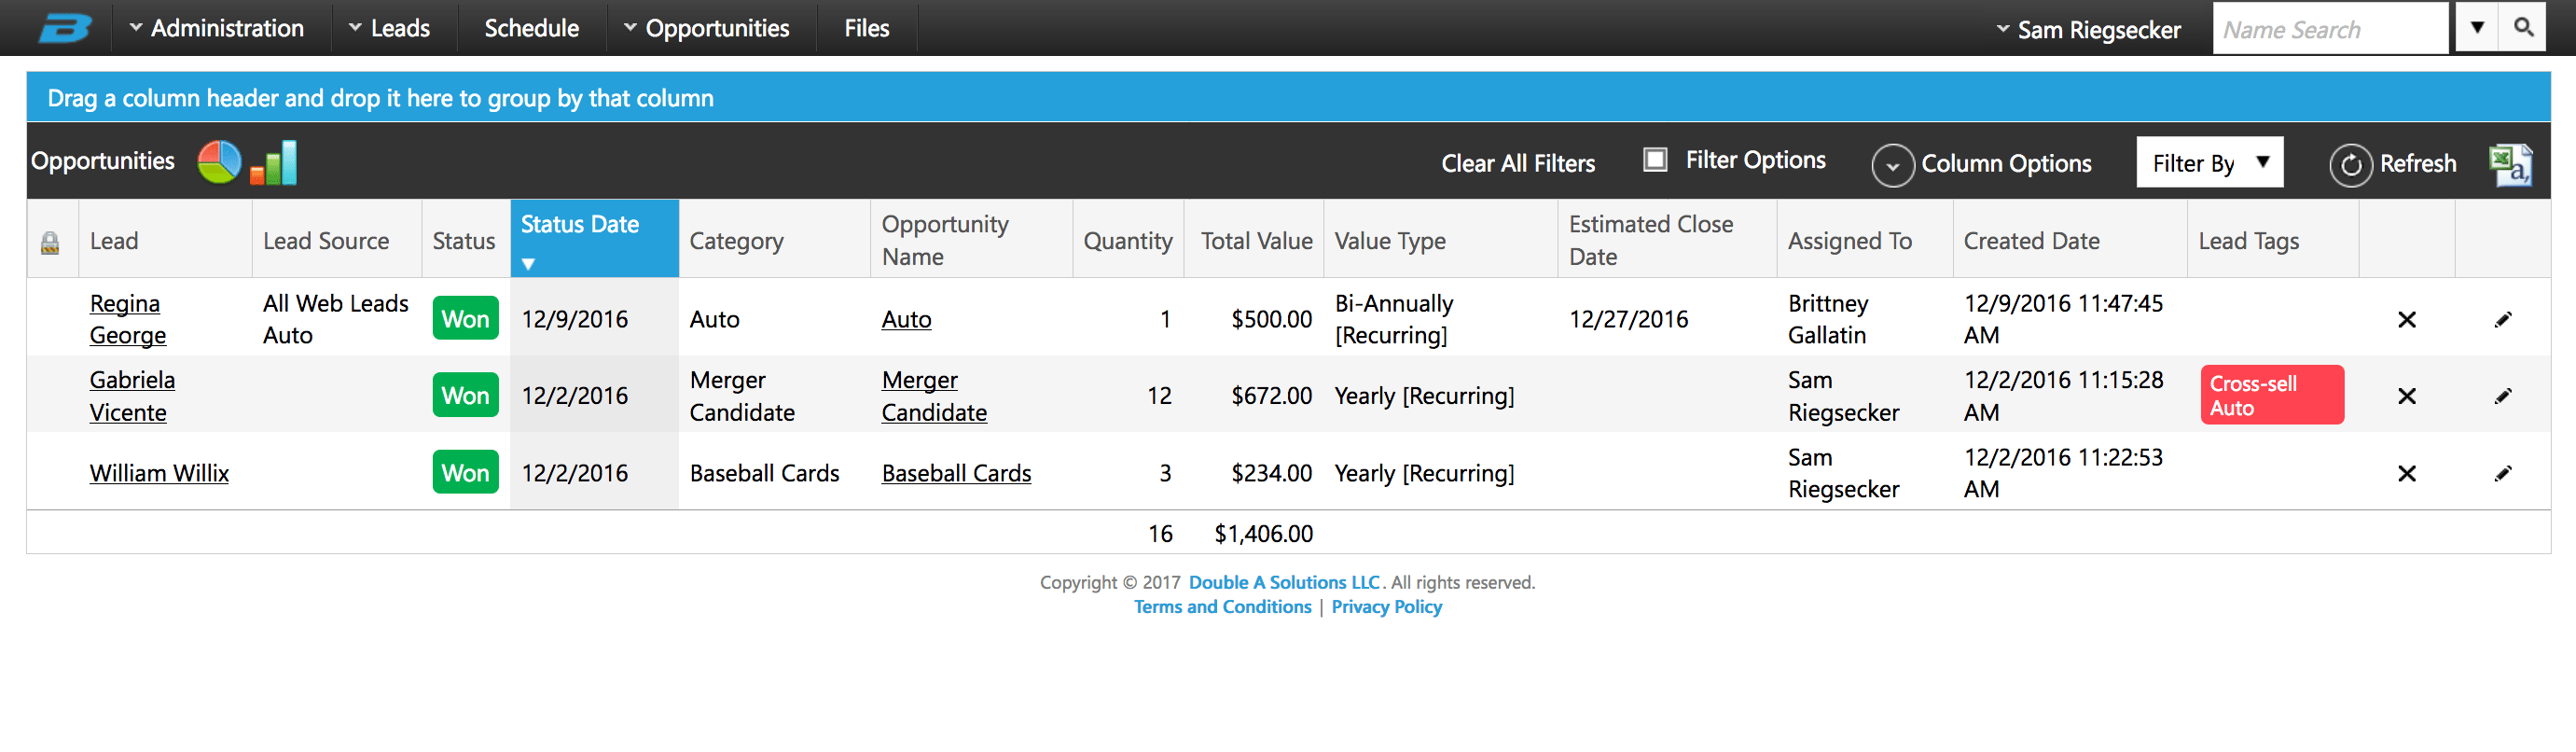
Opportunities Lists:
Within the Opportunities menu, under My Opportunities and All Opportunities are shortcuts to lists of opportunities based on where they are in the sales process. Admin will have access to both of these options, while users will have access to My Opportunities.
This change gives both the User and the Admin of the account the ability to see where they are in terms of sales and opportunities within the system. It makes reporting on the account even easier while giving each person a better visual to see how successful they are.